Economics 2284 O Level 2009 Syllabus- Singapore November Paper
2. The Allocation of Resources: How the Market Works
-Describe the allocation of resources in market system.
In a market system, price is used as a tool to clear the market. Market system is often called free market system. In a market economic system, producers and consumers decide what, how and for whom to produce based on price signals.
Some essential trait of a free market system is that firm move scarce resources to the production of goods and services hat are profitable and demanded by consumers. Hence what is produced in an economy depends on what consumers want and can afford to pay for. Consumer demand for certain good and services are signalled through prices and supplier change the quantity of a certain good and services that they produced based on the price signals. Producer will produce in the cheapest way possible to maximise profits.
When there is an excess demand for a resource, buyers will bid up the price, quantity demanded will fall. As the price is bidded upwards, more sellers will find it profitable to enter the markt, quantity supplied will increase. Such adjustment process continues until quantity demand equals quantity supplied and the market clears at a higher equilibrium price. Price is a signal that helps to clear the market, in a way it is acting as an invisible hand that shifts demand and supply to equilibrium.
On the other hand, when there is an excess supply for a resource, suppliers will push the price downwards in order to sell their resources. As the price falls, fewer and fewer suppliers will find it profitable to remain in the market, hence quantity supplied decreases. For buyers, as price fall, more and more buyers will enter the market, quantity demanded increase. Such adjustment process continues until quantity demanded equals to quantity supplied and the market clears at a lower equilibrium price. Price is acting as a signal that helps to clear the market, in a way it is acting as an invisible hand that shifts demand and supply to a new equilibrium level.
Only those people who are able to pay for the goods and services will be able to consume the good or service.
keyword: equilibrium price, the invisible hand, market clear, excess demand, excess supply
-Describe the allocation of resources in mixed economic systems.
In a mixed economic system, it combines government planning with the use of free market.
The essential feature of the mixed economic system is that private producers have ownership of the resources and they have the freedom to determine the allocation of their resources just like in the case of a free maket. Producers determine which good or service to produce and the amount to produce base on price signals, with the ultimate goal of maximising profit. However, mixed economic system is distinctive from the free market economic system as government or public sector also owns some scarece resources to produce goods and services that they think their country, and its people, need and want. Examples of such goods and services include merit goods and services such as education and vaccination or public goods and services such as street lighting and national defense.
With ovwnership and control over the use of certain resources, the government can also use the resources to set up factories to create jobs for the people if there is high unemployment in the country. Also, the government can make use of the resources to provide goods and services to the poor who do no have the capacity to pay for necessities.
On the other hand, in a mixed economy government can also intervene if it deems that there is overproduction of dangerous or demerit goods. Example of how the government could intervene the consumption of dangerous drug would be to make it illegal to sell them and the governemtn could decrease the production and consumption of demerit goods by placing high taxes on them.
- Demonstrate the principle of equilibrium price.
Equilibrium price is the price at which the market clear meaning that quantity demanded by consumer for a certain good or service equal to the quantity supplied by the producer for the same good and service, in which the market is in a state of equilibirum.
Figure 1: Market for Cars
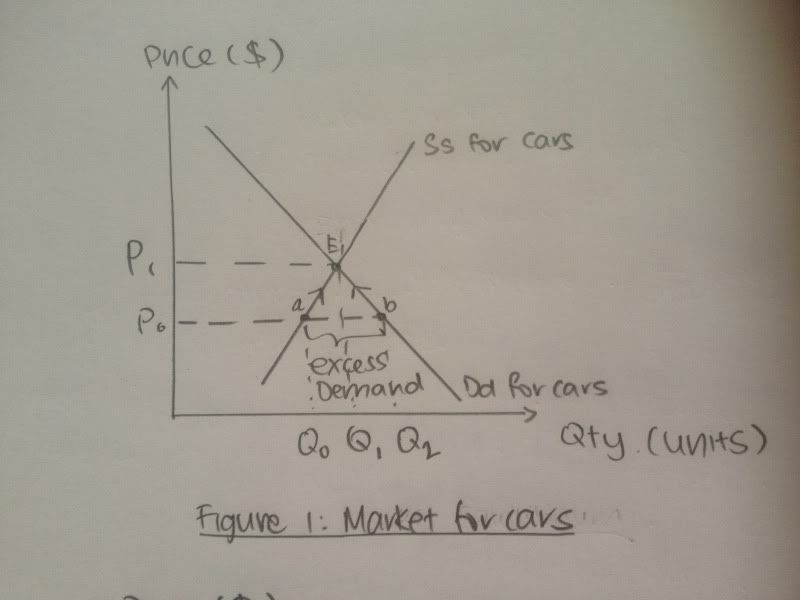
As seen in figure 1 above, at the initial price of P0, quantity demanded of car is Q2 and quantity supplied of cars is Q0. There is an excess demand of Q2-Q0 since Q2>Q0. The excess demand for cars leads to an upwards pressure on the price of cars. As potential car buyers bid up the price of cars, quantity demanded of cars fall along the demand curve (from point b to point E1). As the price of cars increases, more suppliers will find it profitable to allocate more resources to car production. As such, the quantities supplied of cars increase along the supply curve (from point a to E1). The adjustment process continues until quantity demanded equal to quantity supplied at the new equilibrium of E1 at equilibrium price P1 and quantity Q1.As illustrated, equilibrium price is the price that clears the market (Quantity demand equals quantity supplied) and restores the equilibrium in the market. It is the price achieved after all adjustments in quantity demanded and quantity supplied are complete and the market is back to equilibrium.
-Describe the causes of changes in demand.
- Analyse market situations with changes in demand.
Example: Health Scare-Tapioca pearls may cause cancer (other factors).
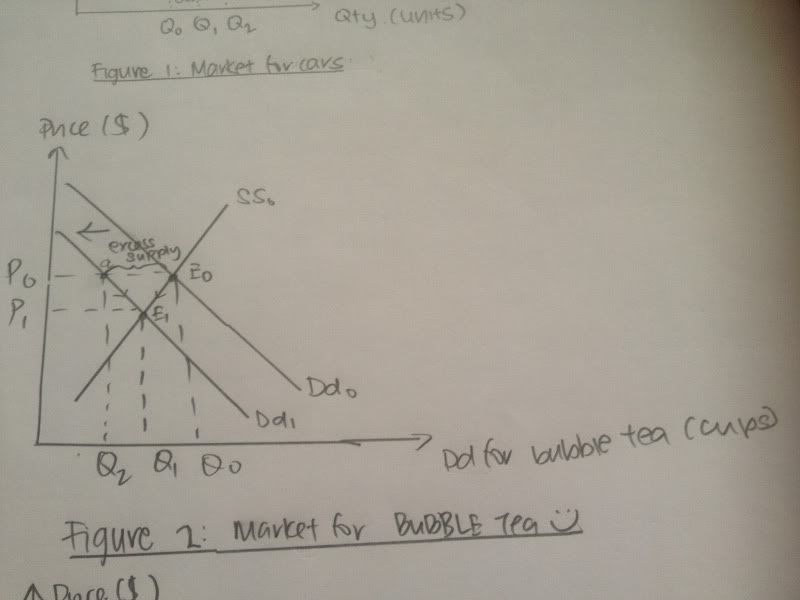
When people are concerned that tapioca pearls may cause cancer, it will lead to a fall in the demand for bubble tea since tapioca pearl is an essential ingredient in bubble tea. This fall in the demand for bubble tea is illustrated by the leftwards shift of the demand curve from Dd0 to Dd1 (as shown in figure 1). At the initial price of P0, quantity demand is Q2 and quantity supplied is Q0. There is an excess supply of Q0-Q2 since Q0>Q2. Excess supply will lead to a downwards pressure on the price of bubble tea. With excess supply, to create their excess inventory, supplier will offer lower price. As price fall, quantity supplied will fall along the supply curve from point E0 to point E1. On the converse, quantity demanded will increase along the demand curve from point a to point E1 when price falls (according to the law of demand). The process of adjustment continues until the new market equilibrium is reached at point E1 where quantity supplied is equal to quantity demanded at a new lower price of P1 and a new lower quantity of Q1.
keywords: shift of the curve to the left/right, old equilibrium, excess supply/excess demand, downwards pressure/ upwards pressure, new equilibrium, must state if the final price/equilibrium quantity is higher or lower.
Tryout: Increase in Demand- During Sars outbreak, there is an increase in the demand for thermometers. (other factors)
-Describe the causes of changes in supply
-Analyse market situations with changes in supply.
Example: Drought in North America, lower harvest of corn.(Global Factors)
Figure 3: Market for Corn in the US
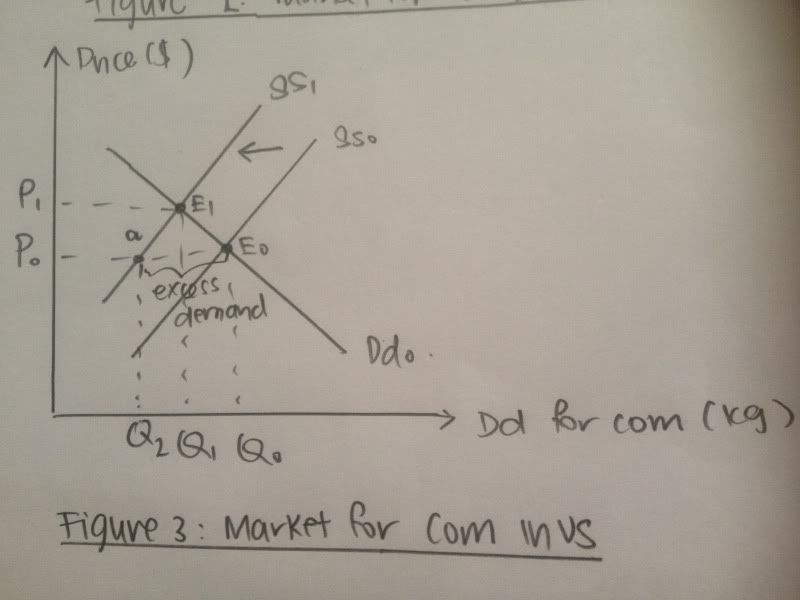
Due to the drought in North America, there is lower harvest of corn. The fall in the supply of corn leads to a leftwards shift of the supply curve from Ss0 to Ss1 (as illustrated in figure 3). At the initial price of P0, quantity demanded of corn is Q0 and quantity supplied of corn is Q2. There is an excess demand for corn as illustrated by Q0-Q2, since Q0 > Q2. The excess demand for corn leads to an upwards pressure on the price of corn. Consumers bid up the price of corn and as the price of corn increases, the quantity demanded for corn falls along the demand curve Dd0 from point E0 to point E1 (according to the law of demand). As the price of corn increases, the profitability of selling corn to the producers increases. By decreasing their inventory, the quantity supplied for corn increases along the supply curve Ss1 from point a to point E1. The adjustment process occurs until a new market equilibrium is reached at the point E1 when quantity demanded equals to the quantity supplied for corn at a new higher pice of P1 and a new lower quantity of Q1.
keywords: shift of the curve to the left/right, old equilibrium, excess supply/excess demand, downwards pressure/ upwards pressure, new equilibrium, must state if the final price/equilibrium quantity is higher or lower.
Tryout: Increase in Supply-Successful completion of a new oil well in Argentina (Other factors)
-Analyse simple market situtations with concurrent changes in demand and supply.
Tryout: Combine an increase in supply with a fall in demand- Successful completion of a new oil well in Argentina however there the citizens of Argentina have become more environmentally conscious and prefer to use more environmentally friendly alternative energy like solar power.
-Define Price Elasticity of Demand
-Define Price Elasticity of Supply
-Perform Simple Calculations involving price elasticity of demand.
(%change in Quantity demanded) / (%change in price)
%change in quantity demand= (initial demand-final demand) / initial demand
%change in price= (initial price- final price) / initial price
Example question
1990 2000
price of cars $10000 $20000
quantity demanded 100 50
Price elasticity of demand (PED) at quantity of 50 in 2000= [(100-50)/100]/[(10000-20000)/10000]
= -0.5
*since it is understood that PED is always negative since by law of demand, price and quantity demanded is inversely related, by convention we can omit the negative sign in front of PED value of
-0.5. We can simply say that the PED is 0.5.
PED>1 => price elastic
PED<1 => price inelastic
PED=1=> unitary elasticity
-Perform simple calculations involving price elasticity of supply.
(%change in Quantity supplied) / (%change in price)
%change in quantity supplied= (initial supply-final supply) / initial supply
%change in price= (initial price- final price) / initial price
Try out this example question
1990 2000
price of cars $10000 $20000
quantity supplied 100 240
-Demonstrate the usefulness of price elasticity in the case of
a) Revenue change
- If PED >1
- fall in price, will increase quantity demanded by more than proportionate => increase in revenue (since revenue=price X quantity demanded)
-increase in price will decrease quantity demanded by more than proportionate => decreasee in revenue.
-If PED <1
-fall in price, will increase quantity demanded by less than proportionate=> decrease in revenue
-increase in price will decrease quantity demanded by less than proportionate => increase in revenue
-if PED=1
-(fall/increase) in price will lead to a proportional (increase/fall) in quantity demanded=> no change in revenue
b) Consumer Expenditure (*here we are talking about total consumer expenditure)
- If PED >1
- fall in price, will increase quantity demanded by more than proportionate => increase in consumer expenditure (since consumer expenditure=price X quantity demanded)
-increase in price will decrease quantity demanded by more than proportionate => decreasee in consumer expenditure.
-If PED <1
-fall in price, will increase quantity demanded by less than proportionate=> fall in consumer expenditure
-increase in price will decrease quantity demanded by less than proportionate => increase in consumer expenditure
-if PED=1
-(fall/increase) in price will lead to a proportional (increase/fall) in quantity demanded=> no change in consumer expenditure.
-Describe the concept of market failure
Market failure occurs when the free market allocation of goods and services does not lead to socially optimum outcome. That is, there exists another conceivable outcome where at least one market participant may be made better-off without making anyone else worse-off. It occurs when external costs and external benefits exists. Individual consumer and firms do not account for such external costs and benefits since they only base their decisions of how much to produce or consume on their own private costs and benefits. Such goods or services are often non-excludable-meaning that it is not possible to exclude the benefits from the consumption of good and services from the public. Whenever external costs or benefit exists, it will lead to an overproduction or underproduction of good and service respectively.
Positive externalities exist when the marginal social benefit of production and or consumption exceeds the marginal private benefit.
Negative externalities exist whent the marginal social cost of production and or consumption exceeds the marginal private cost.
-Explain the reasons for the occurrence of market failure
Private firms in the market will only decide what, how and for whom to produce simply by looking at private costs and benefits. This may leads to overproduction or underproduction of a good or service.
Take for example overproduction of paper by a firm.
Paper production emits alot of steam and unpleasant smell into the neighbourhood. It causes great displeasure for citizens of the neighbourhood. However, the firm when deciding how much paper to produce fail to account for the marginal external social costs that they are imposing on the citizen when they produce more paper. Since a firm base their decision on how much paper to produce by producing the quantity when Marginal private costs (MPC)= Marginal private benefits (MPB), it will lead to an overproduction of paper beyond the socially optimum level as marginal social costs (MSC)> MPC. (***WE KNOW THAT MARGINAL COSTS INCREASES WHEN QUANTITY INCREASES AND MARGINAL BENEFIT FALLS AS QUANTITY INCREASES). Socially optimal output level is achieved only when MSC= Marginal social benefit (MSB).
Individual consumers in the market will only decide what to consumer and what quantity to consumer simply by looking at their own private costs and benefits. Hence this may lead to over consumption or under consumption of a good or service.
Take for example consumption of education/ vaccination by consumers (MSB>MPB -do you know why? Explain why there may be external benefits in the case of education and vaccination before proceeding with your detailed explanation of why market failure exists. For example, more educated society may lead to lower crime rates or that with more people having vaccination for a certain illness, it will prevent the virus or bacteria from spreading to their friends and family).
Take for example overproduction of cigarettes by producers (MPC<MSC).
-Evaluate the merits of the market system
*when asked to evaluate, you must weigh the pros and cons; take a stand on whether the market system is better or not as compared to the fully controlled economy or mixed economy.
-Define private and social costs and benefits.
private costs: costs that accrue to the party directly consuming or producing the good.
private benefits: benefits that accrue to the party directly consuming or producing the good.
social costs: Social costs is inclusive of both the private costs and the external costs. External costs are cost imposed indirectly on the rest of the society by the consumption of a good or service (or production of a good or service) by one individual (or firm). Social costs is the total cost to the entire society of the consumption of a good or service by one individual (or production of a good or service by one firm).
social benefits: social benefit is inclusive of both the private benefits and the external benefits.External benefits are benefits imposed indirectly on the rest of the society by the consumption of a good or service (or prodiction of a good or service) by one individual (or firm). Social benefit is the total benefit to the entire society through the consumption of a good or service by one individual (or production of a good or service by one firm).
-Discuss the conflicts of interest in relation to these costs and benefits (defined in the point above) in the short term and long term through studies of the following issues:
a) conserving resources versus using resources
example conserving primary rain forest versus deforestation for lumber.
private benefit from using more lumber: enjoyment of high quality furniture.
social benefit using more lumbre: private benefit only and practically no external benefit.
private costs of using resources: monetary payment for the use of lumber in terms of furniture that they buy from the producers.
social costs of using resources: other than monetary payment an individual paid for the furniture; external costs includes poorer air quality, higher temperature (forest helps to regulate temperature, provide shade and help to purify the air); increase likelihood of land slide (roots help to hold the soil together) (these are long term costs that are imposed on the future generations), also, there is reduction in the availability of lumber for the future generation to use.
.
individual today: account for only private benefit and costs from using lumber today consume to a quantity where MPB=MPC.
Does not account for the social costs of deforestation in the long term. considering the longterm consequences, Marginal social costs of deforestation >>> marginal private costs of deforestation at market equalibrium quantity of lumber logged for sale today. To maximise individual wellbeing, individual's decision leads to an overproduction of lumber beyond the socially optimal level (socially optimal level accounts for the long terms benefits and costs). Individual decision lead to market outcomes that fails to maximise the well being of the entire society in the long term. Hence it is a CONFLICT OF INTEREST!
b) public expenditure versus private expenditure
Example: public expenditure on education (building more public schools)
private benefit of education: own benefit in terms of future wage increase, higher literacy and being more cultured.
private costs of education: tuition fees, books, stationery
social benefits of education: Other than private benefit, other external benefits include the passing on of skills from superior to junior, mentoring junior workers, more cultured society, a more educated workforce today may help to boost research and innovation- these new technologies invented could help to further boost labour productivity in the future.
social costs of education: other than private costs, there is no significant external costs.
private individual: decide on quantity of education to consume base on quantity when MPC=MPB.
but since MSP>>> MPB, free market allocation leads to an underconsumption of education below socially optimal level (which includes the long term benefits).
need for more public expenditure in education to make up for the underconsumption. This can be done by providing subsidy or free education in public schools.
4 comments:
so good. ty
OMG.!
This is perfect OMG i DON'T KNOW WHAT TO SAY EVEN :)
there are many gramatical mistakes do correct them
Post a Comment